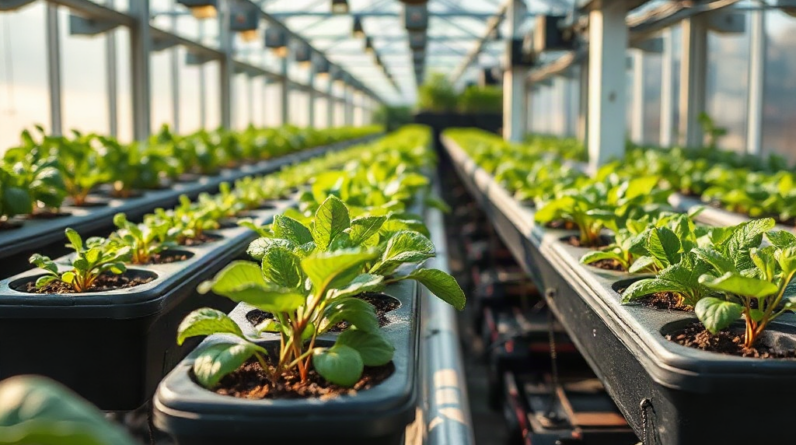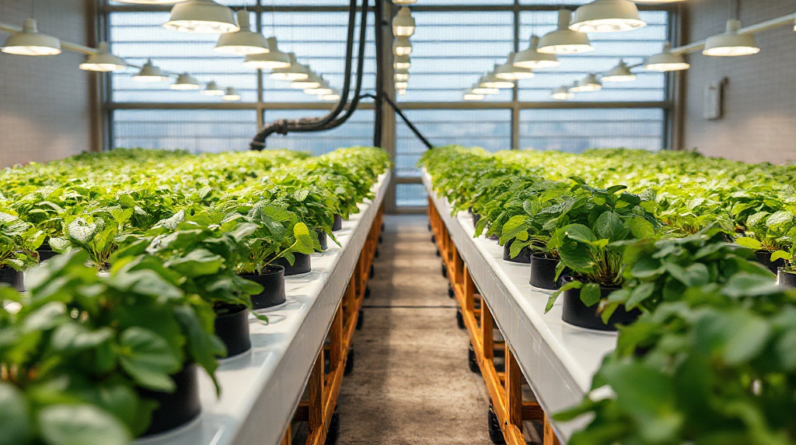
Hydroponic data trends worth charting include nutrient strength, pH, reservoir temperature, water use, light exposure, air conditions, plant growth, and harvest results because these measurements reveal whether a change is helping or creating hidden stress. Record readings at consistent times, pair them with crop-stage notes, and chart rolling trends rather than isolated numbers. A rising water level loss with stable nutrient strength may indicate vigorous uptake, while falling nutrient strength can point to faster water removal or dilution. Charts become most useful when they connect environmental conditions to root health, growth rate, and yield instead of treating every fluctuation as a problem.
The Measurements That Explain a Hydroponic Crop
A useful hydroponic chart links a measurable condition to a plant response. Logging every available number can create a crowded spreadsheet without improving decisions, while a smaller set of consistent measurements can reveal why growth changed. The most informative starting group usually includes reservoir pH, electrical conductivity (EC) or total dissolved solids, water temperature, reservoir volume, air temperature, relative humidity, light timing, plant size, and harvest weight.
Each measurement answers a different operational question. EC indicates the concentration of dissolved fertilizer, but it does not identify which nutrient is present or whether roots are absorbing nutrients evenly. pH describes acidity and affects nutrient availability, yet a single reading says less than a repeated rise or fall. Reservoir volume shows water removal, and comparing that loss with EC helps distinguish active uptake from evaporation, leaks, or a poorly mixed tank.
Plant observations provide the missing biological context. Record leaf count, canopy width, height, root appearance, tip damage, wilt during the light period, and the date of meaningful growth changes. A chart showing stable EC alongside stalled canopy expansion suggests a different investigation from one showing rapidly falling EC and pale new growth. Neither pattern identifies a cause by itself, but each narrows the next check.
Charting also makes comparisons fairer. A basil plant moved to a brighter shelf should not be compared casually with a basil plant grown under a different photoperiod and room temperature. Note cultivar, transplant date, system type, reservoir size, and crop stage. The hydroponic data trends worth charting are the ones that preserve enough context to explain differences rather than merely display them.
How to Chart Nutrients, Water, and Root-Zone Conditions
Nutrient and water charts work best when measurements are taken with the same instruments, at similar times, and before routine adjustments. Measure pH and EC after the reservoir has circulated long enough to mix, then record the result before adding water, concentrate, or pH-adjusting solution. Mark every intervention directly on the chart. An unmarked correction can look like a mysterious plant response a day later.
Use separate lines for pH, EC, and reservoir volume rather than combining them into one score. A line graph makes direction visible, while a note column records events such as topping up, cleaning a filter, changing a pump, or replacing a sensor. Water temperature deserves its own series because warm solution and low oxygen availability can create root-zone risk even when pH and EC appear acceptable.
Consider a simple scenario: a small recirculating system loses volume each day and its EC rises between checks. That pattern may indicate that plants are taking up water faster than dissolved nutrients. If the volume falls unusually quickly while plants look unchanged, inspect tubing, fittings, the air gap, and evaporation surfaces before changing the nutrient formula. Adding water without finding a leak can hide the source and distort later comparisons.
EC trends also require restraint. A stable reading is not proof that roots are healthy, and a changing reading is not automatically a feeding failure. Calibration condition, probe cleanliness, water source, nutrient brand, and temperature compensation all affect interpretation. Compare readings from the same meter whenever possible. If two meters disagree, resolve the measurement problem before making a large nutrient adjustment.
- Daily: record pH, EC, water level, temperature, and visible plant or root changes.
- After an adjustment: write down the amount, time, reason, and follow-up reading.
- Weekly: review slopes and relate them to growth, pruning, light changes, or equipment work.
For a deeper operational record, connect this chart with system maintenance and crop-stage notes. The comparison matters more than the isolated value: a reservoir that behaves differently after a pump replacement deserves attention even if the current reading sits inside a familiar range.
Connecting Environment Trends With Plant Growth
Environmental charts show the conditions surrounding a crop rather than conditions inside the reservoir. Track air temperature and humidity near the canopy, light-on and light-off periods, fan operation, and, where available, light intensity at plant height. A sensor placed across the room may miss the warm, dry pocket directly under a fixture, so location should be recorded with the reading.
Plant growth responds to combinations, not single numbers. A warm room paired with strong light can increase water demand; high humidity can reduce transpiration and leave leaves wet for longer; an inconsistent light schedule can make growth data difficult to compare. Charting these variables beside water use and canopy measurements helps identify relationships. For example, a spike in daily water loss after a fixture is lowered may be expected if leaf temperature and light exposure also rise. A sudden wilt under the same schedule calls for checking roots, flow, and oxygen rather than assuming the plant simply needs more fertilizer.
Growth measurements should be practical and repeatable. Photograph the canopy from the same distance, measure height from the same reference point, count marketable leaves, or weigh a sample harvest. Photographs are especially useful for comparing color, spacing, and leaf posture, but they should not replace notes about crop age and recent maintenance. A larger plant naturally uses more water, so raw daily consumption becomes more meaningful when divided by plant count or compared with canopy size.
Charts should separate correlation from proof. If humidity rises on the same days that leaf edges brown, humidity may be relevant, but nutrient concentration, airflow, root condition, and light intensity may also have changed. Change one major variable at a time when the system allows it, and allow enough observation time to see whether the response is consistent. Under space or budget limits, prioritize canopy-level temperature and humidity, light timing, and water use before buying a long list of sensors.
A useful companion to these records is harvest and crop-performance data. Environmental control has practical value only when it can be connected to healthier growth, more predictable timing, reduced waste, or a better-quality harvest.
Turning Charts Into Better Growing Decisions
The purpose of a chart is to support a decision, not to produce an attractive graph. Review data by asking three questions: what changed, when did the plant response appear, and what other event occurred at the same time? This sequence prevents a common mistake—reacting to the latest number without checking the preceding trend.
Use rolling averages for noisy measurements such as daily water use, but keep the original readings available. A seven-day average can reveal that consumption is gradually increasing even when individual days vary. For pH or EC, a chart with adjustment markers may be more informative than an average because repeated corrections can signal an underlying mixing, dosing, or crop-stage issue.
Prioritize trends according to consequence. A minor variation in canopy width may not justify intervention, while a continuing rise in water temperature combined with root discoloration deserves prompt investigation. The following decision order keeps responses proportionate:
- Verify the measurement: check calibration, probe cleanliness, sensor placement, and whether the reservoir was mixed.
- Check physical causes: inspect leaks, pump flow, air delivery, tubing, light position, and room conditions.
- Compare related variables: pair EC with water level, pH with additions, and growth with light and temperature.
- Make one controlled change: record the adjustment and define what response would count as improvement.
- Review the result: retain the failed intervention in the log so it is not repeated under the same conditions.
Imagine a chart showing reduced harvest weight after a change in nutrient concentration. It would be weak reasoning to blame the formula immediately if the same week included a clogged return line and a major temperature shift. A controlled comparison using similar plants and a stable environment provides stronger evidence than a before-and-after impression. Home growers may not have enough plants for formal trials, but disciplined notes still improve judgment.
Charts also expose tradeoffs. More frequent measurement may catch drift sooner, but it consumes time and can encourage unnecessary corrections. Automated sensors reduce manual work but still need inspection and calibration. The best system is the one the grower can maintain consistently and interpret honestly.
Common Charting Mistakes and a Practical Schedule
The most damaging charting mistake is inconsistent measurement. Readings taken at random times can confuse normal light-cycle variation with a system problem. Measuring pH immediately after dosing, then comparing it with an undisturbed morning reading, produces a misleading trend. Choose a routine—such as before the main daily check—and keep it stable.
Another failure is recording numbers without units, crop stage, or intervention notes. “EC 1.4” is less useful when the reader cannot tell whether the instrument reports EC or TDS, whether the value was taken before or after topping up, or whether the plants were seedlings or mature herbs. Use fixed labels, consistent units, and a short event code such as “top-up,” “clean,” “pruned,” or “pump check.”
Do not chart only successful outcomes. Failed experiments, missed readings, pest observations, and equipment interruptions explain apparent anomalies. A gap in the record is itself useful information if it is labeled. Avoid treating a neat upward line as proof of improvement; a larger plant may consume more water while suffering from poor root conditions, and a heavier harvest may reflect a different plant count.
A manageable schedule might include daily reservoir and environmental readings, twice-weekly photographs and canopy notes, and a weekly review of water use, growth, maintenance, and harvest data. At each review, choose one question for the next period, such as whether a fan change affects leaf posture or whether a reservoir cleaning changes pH drift. This keeps data collection tied to a decision instead of turning it into administrative work.
Start with a spreadsheet or paper log before investing in automation. Once the routine proves useful, automate repetitive readings while preserving manual observations. A chart should make the next action clearer: verify an instrument, inspect equipment, adjust the environment cautiously, or leave a stable system alone. That last option matters because unnecessary intervention can create more variation than the original trend.
Frequently Asked Questions
What should a beginner chart first in a hydroponic system?
Record pH, EC, reservoir volume, water temperature, room conditions, and plant observations. Those measurements provide more decision value than tracking many variables inconsistently.
How often should hydroponic readings be recorded?
Daily readings are useful for small systems, especially when plants are changing quickly. Weekly trend reviews matter more than taking extra readings that cannot be maintained.
Why chart reservoir volume alongside EC?
Volume shows how much water leaves the system, while EC shows dissolved-solution concentration. Together they help distinguish plant uptake, evaporation, dilution, and possible leaks.
Are automated hydroponic sensors worth using?
They may be worthwhile when frequent measurement is difficult, but sensors still require calibration, cleaning, and sensible interpretation. Automation does not correct poor placement or incomplete notes.
What does a useful trend look like?
A useful trend connects a repeated measurement with a plant or system outcome, such as water use rising with canopy size or pH drift following a maintenance change.
Further Reading
Authoritative Sources
- Academy of Nutrition and Dietetics
eatright.orgProfessional nutrition guidance, healthy eating resources, and practical dietitian-reviewed advice.
- U.S. Department of Agriculture
usda.govOfficial food, nutrition, agriculture, and consumer guidance from the USDA.
- NIH Office of Dietary Supplements
ods.od.nih.govResearch-based fact sheets on nutrients, supplements, dietary intake, and safety considerations.
- International Society of Sports Nutrition
sportsnutritionsociety.orgEvidence-informed sports nutrition resources and position stands for active people and athletes.
Conclusion
Good hydroponic charting turns scattered readings into evidence for practical choices. Begin with pH, EC, water level, temperature, light timing, canopy observations, and harvest results, then add variables only when they answer a real question. Keep measurement times, units, instruments, and crop-stage notes consistent. Mark every intervention so a change in the graph has an explanation attached to it.
Review related trends together rather than reacting to a single number. Verify the measurement, inspect physical equipment, compare environmental conditions with plant response, and make one controlled adjustment when action is justified. A simple record kept faithfully will usually outperform an elaborate dashboard filled with unreliable readings.