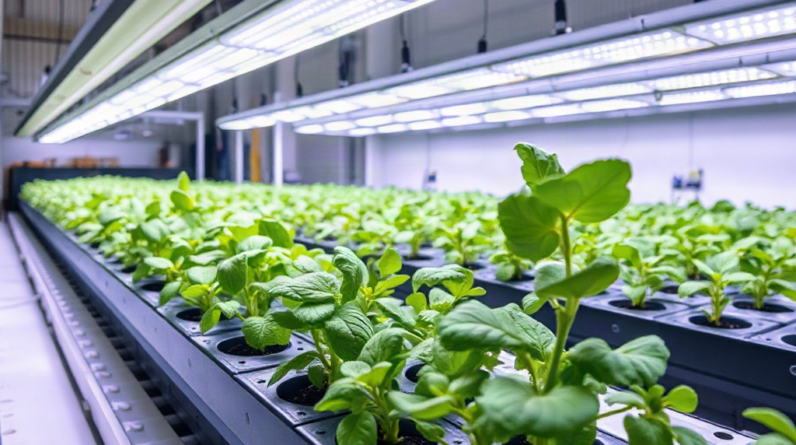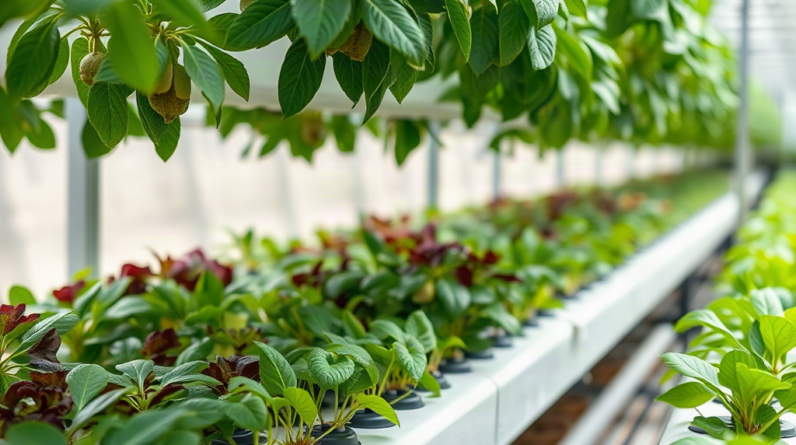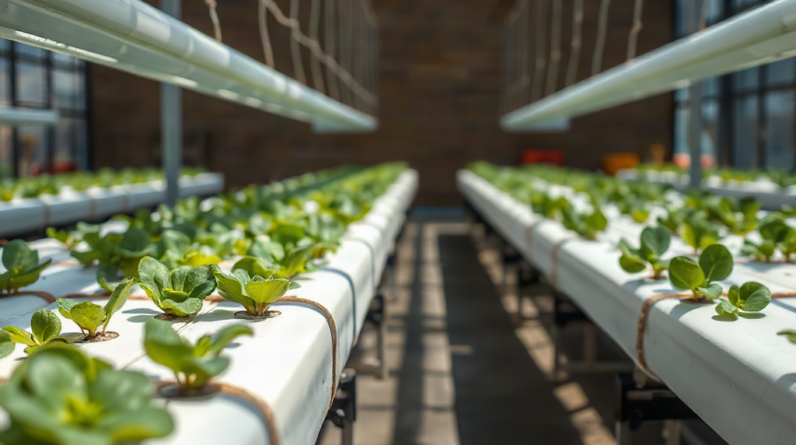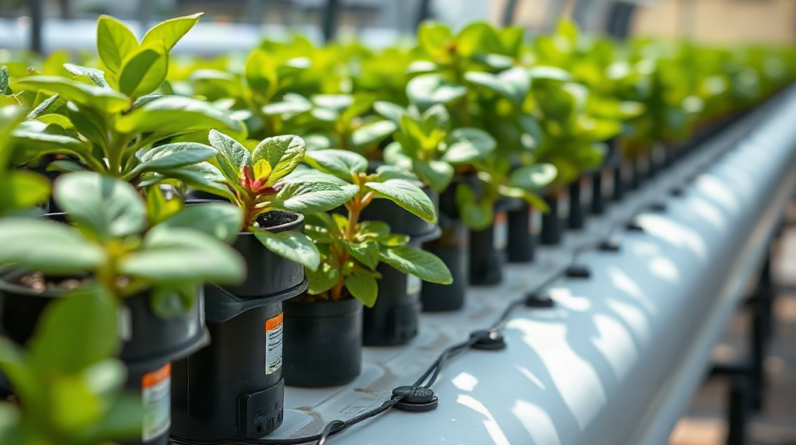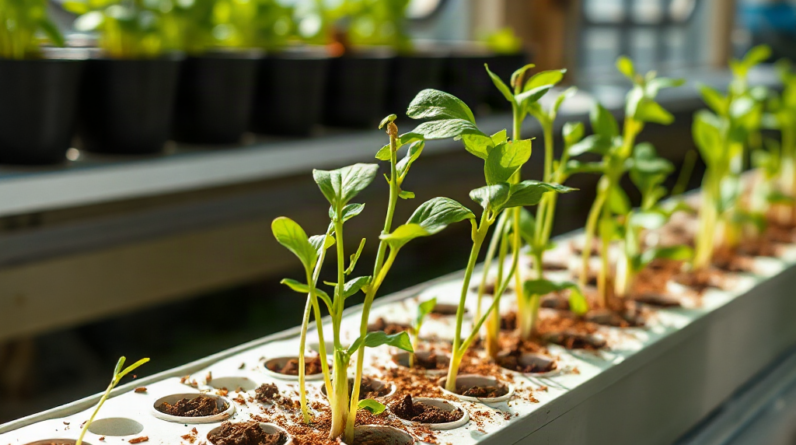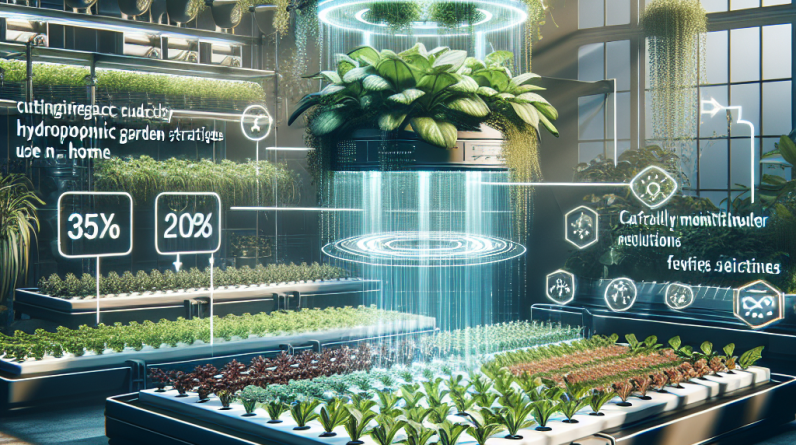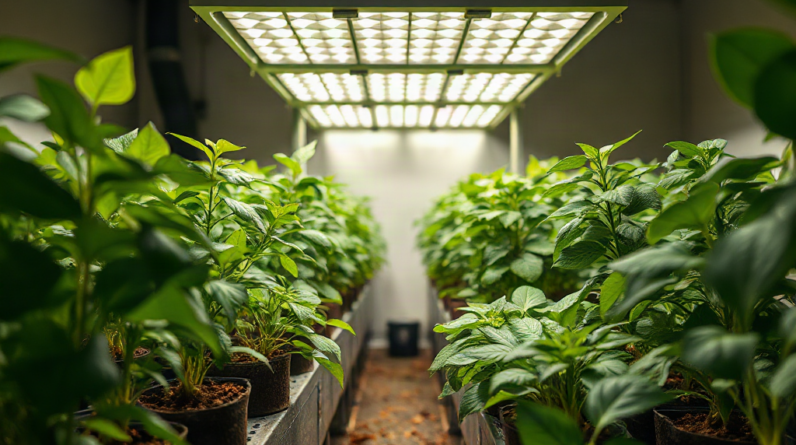
Evaluate the impact of lighting on growth by recording canopy PPFD, daily light integral, photoperiod, plant dimensions, and harvest weight while holding nutrients, temperature, airflow, and root-zone conditions as steady as possible. Establish a baseline, change only one lighting variable, and compare equal groups over a defined growth period. Measure leaf expansion, internode spacing, stem strength, color, and usable yield rather than relying on height alone. Check several canopy positions because a strong center reading can hide dim edges or damaging hot spots. Lighting is helping when compact, uniform development and yield improve without bleaching, curling, excess heat, or declining efficiency.
Define What Better Growth Means
Growth must be translated into measurable outcomes before a lighting change can be judged. A taller plant is not necessarily a better plant: excessive stem extension may indicate inadequate light, while compact growth can reflect stronger illumination and better canopy development. Select measurements that match the crop and production goal. Leaf number and fresh mass are useful for lettuce, whereas flowering crops require attention to branching, flower development, fruit set, and marketable harvest weight.
Record a baseline before moving fixtures, changing intensity, or extending the photoperiod. Useful baseline observations include plant height, canopy width, leaf count, internode length, stem diameter, root appearance, days to harvest, fresh harvest weight, and discarded tissue. Photograph plants from the same position under neutral room light so changes in shape and color are easier to compare. Grow-light color can make healthy leaves look pale or hide early chlorosis.
Choose one primary outcome and several supporting indicators. For a leafy-green rack, the primary outcome might be usable fresh weight per growing site. Supporting indicators could include days to harvest, edge burn, canopy uniformity, and electricity used during the crop cycle. This distinction prevents a visually impressive result from being mistaken for an operational improvement. A larger canopy has limited value if it requires a longer cycle or produces more damaged outer leaves.
Environmental records are part of the baseline because light does not act alone. Higher photon delivery can increase photosynthetic demand for carbon dioxide, water, and mineral nutrients. It may also raise leaf and solution temperatures. If air temperature rises after a fixture is lowered, the resulting growth change cannot automatically be attributed to light intensity. Reservoir electrical conductivity, pH, solution temperature, room temperature, relative humidity, airflow, and plant spacing should therefore be logged alongside plant measurements.
A practical evaluation begins with a written question such as, “Does raising canopy intensity improve marketable basil mass without increasing leaf stress or energy use per gram?” That question is more useful than asking whether the plants “like” a lamp. Readers building their first record sheet for how to evaluate the impact of lighting on growth should favor a small set of repeatable measurements over a long list collected inconsistently.
Measure the Light Reaching the Canopy
Fixture wattage and hanging height do not reveal how much photosynthetically active radiation reaches each plant. Photosynthetic photon flux density, or PPFD, describes the photon flow arriving at a surface at a given moment. A quantum sensor provides the most relevant canopy measurement. Phone applications and inexpensive lux meters can show relative differences, but their readings may be inaccurate under LED spectra and should not be treated as interchangeable with calibrated PPFD measurements.
Measure across the entire growing area rather than directly beneath the fixture alone. Divide the canopy into a simple grid and take readings at plant-top height in the center, corners, and edges. Record the lowest, highest, and average values. A center measurement can look adequate while perimeter plants receive much less light. Conversely, closely spaced fixtures may create overlapping hot spots that expose a narrow strip of leaves to substantially greater intensity.
PPFD captures intensity at the moment of measurement; daily light integral, or DLI, describes the accumulated photosynthetic light delivered over the full photoperiod. DLI is calculated from PPFD and the number of lighting hours. This matters because moderate intensity over a long day may deliver a similar photon total to higher intensity over a shorter day, yet the plants may not respond identically. Photoperiod can influence flowering behavior, dark-period processes, and operating temperature, so equal DLI does not guarantee equal crop development.
Take measurements after fixtures have reached normal operating temperature and with reflective doors, curtains, or rack panels in their usual positions. Measure again as the canopy rises. A young seedling several centimeters below its future canopy position can receive far less light, while a rapidly stretching shoot may approach an intense zone near the fixture. Fixed-height readings miss this changing relationship.
Use manufacturer distribution maps as planning information, not as a substitute for measurements in the actual room. Wall reflectivity, fixture spacing, rack dimensions, dimmer settings, and sensor distance all affect delivery. A compact measurement routine is sufficient:
- Map: Record canopy-level PPFD at consistent grid points.
- Calculate: Convert average PPFD and operating hours into DLI.
- Verify: Repeat readings after height, spacing, or dimming changes.
- Compare: Pair the map with growth and stress observations from the same locations.
The common mistake is optimizing the average while ignoring uniformity. If center plants grow quickly but edge plants lag, raising total output may worsen the center before correcting the perimeter. Adjusting fixture spacing, adding reflective surfaces, or narrowing the planted area may produce a more useful canopy than simply increasing power.
Run a Controlled Lighting Trial
A controlled comparison provides stronger evidence than changing a whole grow room and judging the next harvest from memory. Divide similar plants into a control group and a test group. Keep cultivar, seed lot, plant age, reservoir recipe, spacing, airflow, temperature, and measurement schedule as consistent as practical. Apply one defined lighting change to the test group, such as a higher dimmer setting, altered fixture height, or different photoperiod.
Replication matters because individual plants vary. Comparing one basil plant under each condition can produce a misleading result if one seedling began larger or suffered transplant damage. Several plants per treatment provide a clearer view of the typical response. Rotate positions only if the purpose is to average out location effects; do not rotate plants when the trial is intended to diagnose uneven light across a shelf.
Set the trial duration around the response being measured. Leaf angle and heat stress can change within hours, but meaningful differences in biomass, internode length, or harvest timing require repeated observations over days or a complete crop stage. Record measurements on the same day and at roughly the same point in the light cycle. Fresh weight can vary with plant water status, so inconsistent harvest timing weakens the comparison.
For example, a grower testing a longer photoperiod might keep PPFD unchanged and compare two equal groups of lettuce. Plant width, leaf count, visible edge injury, fresh harvest mass, and total fixture operating hours would be recorded. If the longer day increases gross mass but also raises tip burn and trimming losses, marketable mass may show little benefit. The trial has still produced a useful answer: photon delivery increased, but crop quality or environmental capacity became the constraint.
Change one major variable at a time whenever possible. Lowering a fixture while extending the photoperiod and adjusting nutrients may improve growth, but the responsible factor remains unknown. Advanced growers can test interacting variables deliberately, yet that requires more treatment groups and careful records. For a home or small commercial system, sequential trials are easier to interpret.
A simple trial log should capture date, plant age, dimmer setting, fixture distance, PPFD grid, lighting hours, DLI, climate readings, reservoir values, plant measurements, photographs, and harvest results. This experimental approach is the most dependable way to apply how to evaluate the impact of lighting on growth without confusing coincidence with cause.
Interpret Plant Responses and Warning Signs
Plant form reveals whether delivered light is usable, but no single symptom proves that lighting is responsible. Low-light responses commonly include elongated internodes, thin stems, leaves angled toward the fixture, slow canopy fill, and poor growth at shelf edges. These patterns become more persuasive when they align with low PPFD readings and appear in the dimmest mapped positions.
Excessive intensity may produce bleaching near the canopy top, upward or downward leaf curling, dry patches, compact leaves, or stalled growth. Similar damage can result from heat, low humidity, strong airflow, salinity, or root problems. Check leaf temperature, air conditions, solution strength, roots, and symptom location before reducing output. Damage concentrated directly below a fixture supports a light or heat explanation; symptoms spread evenly through the crop may point elsewhere.
Color alone is especially easy to misread. Some cultivars naturally become lighter or develop stronger pigmentation under intense light. Nitrogen, magnesium, iron, pH, and root-zone oxygen can also alter leaf color. Compare new growth with older tissue, inspect roots, review nutrient records, and view the plant outside the colored grow-light environment. A lighting adjustment should not become the default response to every pale leaf.
Look for combined signals rather than isolated traits. Productive lighting often produces steady leaf expansion, appropriate internode spacing for the cultivar, sturdy stems, an even canopy, healthy roots, and increasing harvest mass. Failure may appear as a plateau: power or DLI rises, but dry or fresh biomass stops increasing while stress becomes more frequent. That plateau indicates another resource or environmental factor may now limit the crop.
Location-based comparisons are particularly revealing. Suppose plants beneath the center of an LED bar remain short and pale while edge plants stretch. A PPFD map may show both excessive center intensity and insufficient edge delivery. Raising the fixture could improve distribution even though it reduces peak intensity. Dimming alone might relieve the center but leave the edges deficient. The correct decision depends on the spatial pattern, not merely the average reading.
Do not treat fast vertical growth as proof of success. For compact herbs and greens, extension can lower quality and create an uneven canopy. Evaluate architecture against the intended harvest. A healthy response should improve the usable portion of the crop without adding preventable stress, excessive trimming, or a new climate problem.
Decide Whether More Light Is Worth the Cost
The best lighting setting is the one that produces an acceptable crop efficiently, not necessarily the highest output the fixture can deliver. Additional photons often show diminishing returns when leaves approach their usable light capacity or when carbon dioxide, temperature control, water supply, or root health becomes limiting. Under those conditions, electricity consumption and heat can rise faster than harvest value.
Compare marketable yield rather than total plant weight. Remove damaged, discolored, or otherwise unusable tissue before weighing, and use the same trimming standard for each treatment. Then relate marketable mass to fixture operating hours or measured electricity consumption. A plug-in energy meter can provide more useful operating data than relying on the maximum wattage printed on a product label, especially when lights are dimmed.
Heat management belongs in the calculation. A higher setting may require stronger exhaust, air conditioning, or greater reservoir cooling. In a cool room, fixture heat may be manageable or occasionally useful; in a stacked rack with limited clearance, the same change can push leaf temperature beyond a productive range. Fixture efficiency, room design, and local electricity costs therefore affect whether a biological gain is an operational gain.
Prioritize uniformity before pursuing peak intensity. Correct fixture alignment, canopy distance, plant spacing, and reflective losses first. Next, test modest intensity or photoperiod changes and allow enough time for a measurable crop response. If marketable yield rises without new stress, repeat the result before adopting it across the entire system. If gains flatten, improve the limiting condition rather than continuing to add light.
Beginners should use conservative comparisons with stable environmental settings. More advanced growers may compare yield per unit of growing area, energy per unit of marketable mass, crop-cycle duration, and labor caused by uneven development. Neither approach needs elaborate laboratory equipment, but both require consistent definitions and records. A precise meter cannot rescue a trial in which plant age, nutrient conditions, or harvest standards changed between groups.
A sound final decision combines three layers: measured light delivery, documented plant response, and operating cost. Agreeing evidence across all three is more reliable than a dramatic photograph or a single center-canopy reading. That standard also makes future fixture changes easier to evaluate because each new trial can be compared with a credible baseline.
Frequently Asked Questions
Can plant height alone show whether lighting is working?
No. Rapid height gain may be low-light stretching. Pair height with internode length, canopy width, stem strength, leaf development, and marketable harvest weight.
What light measurement is most useful for hydroponic crops?
Canopy-level PPFD measured across a grid is the strongest starting point. Combine it with photoperiod to estimate DLI and reveal differences between intensity and total daily exposure.
How often should canopy light be measured?
Measure after setup changes and whenever plant height substantially changes. Fast-growing crops may need checks during several growth stages because the canopy moves closer to the fixture.
How can light stress be separated from nutrient stress?
Compare symptom location with the PPFD map, then check roots, pH, electrical conductivity, solution temperature, airflow, and leaf temperature. Light-related injury often follows fixture position.
Should intensity or photoperiod be adjusted first?
Choose one variable and preserve the other for a clean comparison. Correct severe canopy nonuniformity first; then test a modest intensity or duration change against an unchanged control.
Conclusion
Reliable lighting decisions come from matching a canopy light map with consistent crop and operating records. Define a crop-specific result, establish baseline PPFD and DLI, and compare similar plant groups after changing only one major setting. Give more weight to marketable harvest, canopy uniformity, architecture, and stress than to plant height or visual brightness.
Begin by mapping the center and edges at plant-top height, then record the current photoperiod, climate, reservoir conditions, and growth measurements. Test a modest adjustment and repeat the measurements through a meaningful growth stage. Keep the change only if the biological gain remains useful after trimming losses, heat, crop-cycle time, and electricity are considered. If output rises while growth plateaus or injury appears, investigate distribution and environmental limits before supplying more light.