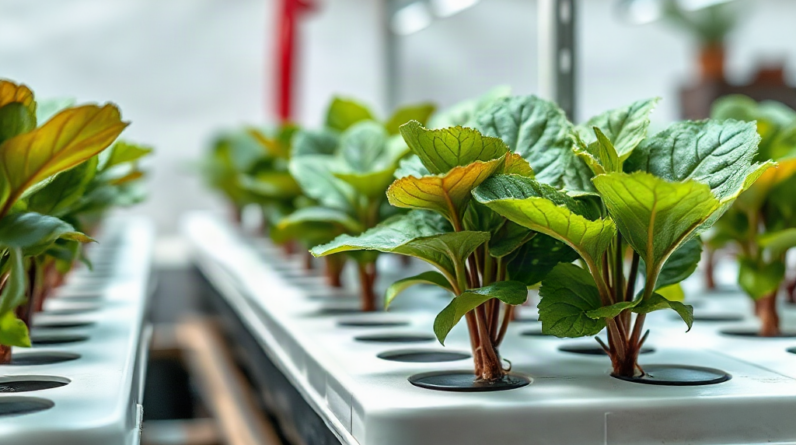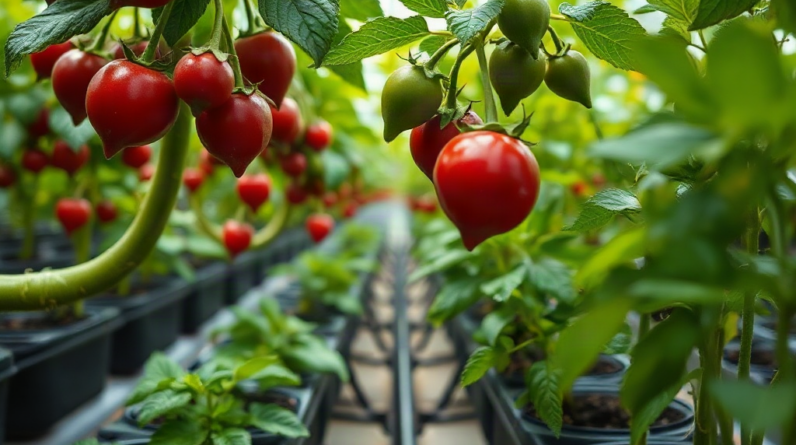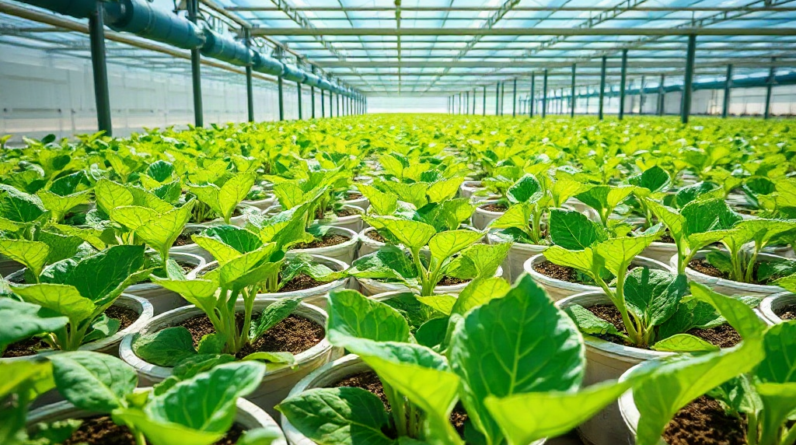
Evaluate the impact of pests on hydroponic crops by measuring pest abundance, plant injury, affected growing area, growth changes, and harvest losses against a healthy baseline. Inspect leaves, stems, roots, traps, and growing channels on a fixed schedule, recording both pest counts and damage severity by crop zone. Separate active pest injury from nutrient, pH, temperature, and root-zone problems before assigning the cause. Repeated observations matter more than a single count: rising trap captures, expanding leaf damage, slowed new growth, and contamination of marketable produce indicate that the infestation is becoming economically or operationally important.
Define What Pest Impact Means for the Crop
Pest presence and pest impact are not the same measurement. A few fungus gnats on a sticky card may have little effect on mature lettuce, while a small aphid colony hidden in the center of a young leafy crop can quickly reduce marketability. Evaluation should therefore connect the organism to plant injury, crop stage, spread, and the value of the affected plant material.
Use several impact categories rather than relying on visible insect numbers alone. Direct feeding injury includes stippling, distorted shoots, mines, holes, rasped tissue, and damaged roots. Indirect effects include honeydew, sooty growth, shed skins, webbing, or insects lodged in harvestable leaves. Operational impact also matters: a crop may retain acceptable biomass yet require so much cleaning and sorting that the harvest is no longer practical.
Crop stage changes the meaning of the same observation. Thrips feeding on a mature basil leaf may cause a limited cosmetic defect, but feeding at a young growing point can distort multiple leaves as they expand. Root-feeding larvae may be more consequential in seedlings with small root systems than in established plants. Record the crop species, cultivar, age, days from harvest, and intended quality standard whenever damage is scored.
A useful baseline comes from an unaffected bench, channel, tower, or earlier production cycle managed under comparable conditions. Compare canopy size, leaf count, root appearance, fresh mass where practical, and the proportion of produce rejected at harvest. Avoid treating a distant room or a crop under different lighting as a clean comparison; environmental differences could explain the growth gap.
For a compact assessment, document four dimensions:
- Extent: the percentage of plants or production zones affected.
- Intensity: the amount of injury on each affected plant.
- Trajectory: whether pest activity and injury are increasing, stable, or declining.
- Consequence: effects on growth, harvest timing, quality, labor, and disposal.
The common mistake is declaring success because plants remain alive. Hydroponic crops are often grown for clean, uniform, highly marketable leaves or fruit, so cosmetic contamination and delayed harvest can matter before severe plant decline appears. A sound evaluation defines acceptable quality before monitoring begins rather than moving the standard after pests are found.
Build a Repeatable Inspection and Sampling Routine
Consistent sampling reveals whether an infestation is localized, spreading, or merely fluctuating. Walk the production area in the same direction at the same time of day, examining a defined number of plants from every zone. Include entrances, vents, propagation areas, channel ends, dense canopy edges, and locations near recently introduced plants because pest pressure is rarely distributed evenly.
Inspect plant structures that match the suspected pest. Aphids often cluster on tender shoots and leaf undersides. Thrips may hide in folded leaves or flowers. Spider mites are commonly detected through stippling, fine webbing, and close inspection of lower leaf surfaces. Fungus gnat adults appear on traps, but larvae and root-zone conditions require separate examination. Looking only at the upper canopy creates false confidence.
Sticky cards are trend tools, not complete crop assessments. Position and replace them consistently, label each card with its zone and date, and count the relevant captures at regular intervals. A trap near an open door cannot be compared fairly with one inside a dense crop unless placement differences are acknowledged. Trap catches can indicate adult movement while missing wingless colonies or immature stages already feeding on plants.
A practical routine for how to evaluate the impact of pests on hydroponic crops combines three records: plant inspections, trap observations, and crop performance. On each inspection date, sample fixed plants plus a smaller group selected at random. Marking only damaged plants can track progression, but it can also miss new outbreak locations.
- Divide the room into identifiable zones based on benches, channels, racks, or irrigation loops.
- Inspect the same minimum number of plants per zone and add random plants each round.
- Record pest life stage, count or count range, injury type, and affected plant structure.
- Photograph representative plants from the same angle and distance.
- Note crop age, harvest date, recent plant arrivals, and any control action.
Suppose one rack has two heavily infested plants beside an intake vent while the remaining room is clean. A room-wide average would make the problem appear minor, yet the location suggests an active entry point and a source capable of spreading. Record both the total incidence and the worst zone. Conversely, one damaged leaf retained after a successful intervention should not be interpreted as continuing injury; old tissue rarely repairs itself. New growth and fresh pest activity provide the better test.
Distinguish Pest Injury From Environmental Disorders
Accurate attribution prevents unnecessary pesticide use and missed system failures. Chlorosis, curling, stunting, and root discoloration can arise from pests, but they can also reflect pH drift, nutrient imbalance, excessive solution temperature, low dissolved oxygen, salinity, spray injury, or uneven light. Before assigning impact to a pest, verify that the observed organism and injury pattern plausibly fit together.
Distribution is a powerful diagnostic clue. A nutrient or irrigation problem often follows a system boundary, such as every plant on one channel or the downstream end of a loop. Mobile pests may form irregular hotspots around entry points, plant contact areas, or recently introduced material. This distinction is not absolute: pests can spread along connected canopies, while clogged emitters can create scattered symptoms. Map the pattern rather than relying on one symptomatic plant.
Examine the newest and oldest tissue separately. Existing scars, mines, or distorted leaves remain after pests decline, so cumulative damage can exaggerate current activity. Fresh stippling, expanding colonies, new webbing, active larvae, or distortion appearing on newly opened leaves indicates continuing pressure. When roots look brown, assess texture, odor, oxygenation, and solution temperature as well as the possible presence of larvae; color alone does not identify the cause.
A simple exclusion comparison can strengthen the conclusion. Isolate several lightly affected plants, remove visible pests where feasible, and keep crop conditions comparable. Track new leaf development against untreated affected plants and healthy reference plants. This is not a substitute for laboratory identification, but it may show whether suppressing pest exposure changes the rate of new injury. Avoid changing nutrition, lighting, sanitation, and pest controls simultaneously, because the improvement cannot then be attributed with confidence.
Close inspection may require a hand lens, white paper for tapping foliage, or magnified photographs. Identification should reach a level that supports a sensible response; confusing predatory mites with pest mites, for example, can undermine biological control. If the organism remains uncertain or symptoms continue without a clear culprit, seek diagnostic help from a university extension service, crop adviser, or diagnostic laboratory.
The recurring failure is counting every unhealthy plant as pest-damaged after an insect has been discovered somewhere in the room. A stronger record includes a confidence note such as confirmed, probable, or uncertain. That distinction keeps estimated losses credible and directs attention to reservoir conditions or equipment faults that may be affecting the crop at the same time.
Convert Observations Into Severity and Trend Scores
A scoring system turns scattered observations into comparable evidence. Keep it simple enough that different people can apply it consistently. For foliar crops, a zero-to-four injury scale may work: zero for no injury, one for isolated marks, two for visible but limited injury, three for extensive damage or contamination, and four for severe distortion, decline, or unmarketable tissue. Write crop-specific descriptions for every level and attach reference photographs.
Score pest abundance separately from plant injury. A plant may carry numerous adult whiteflies before showing substantial chlorosis, while an earlier infestation may leave damaged tissue after current counts fall. Combining both into one number hides that timing difference. Record incidence as the share of sampled plants with confirmed pests, severity as the average injury rating, and trap activity as captures per card over a fixed period.
Trend is usually more informative than a single high or low observation. Compare equivalent sampling intervals and ask whether occupied zones, affected plants, fresh injury, and captures are moving in the same direction. If trap catches fall but the percentage of colonized plants rises, adults may be settling into the canopy or the traps may no longer reflect the active life stage. If injury stabilizes and clean new growth appears, the crop may be recovering even though old leaves still look poor.
Production measures provide the consequence layer. Compare affected and reference areas using indicators that suit the crop: days to harvest, harvested mass per plant or channel, rejected units, trimming time, or missing plants. For fruiting crops, include flower injury, fruit scarring, and aborted flowers where those outcomes plausibly relate to the pest. Do not claim a yield loss from visual symptoms alone when harvest records are available.
For example, two lettuce zones might both receive an injury score of two. The first remains stable for a week and produces clean inner leaves; the second shows rising aphid incidence near harvest and requires extensive sorting. Equal visual scores do not mean equal impact because trajectory and contamination alter the decision. A documented method for how to evaluate the impact of pests on hydroponic crops should preserve these separate dimensions rather than collapsing everything into an unexplained average.
Complex formulas can appear precise without improving decisions. Weighting severity, incidence, yield, and labor may be useful for larger operations, but the weights must reflect actual crop value and quality requirements. For a smaller garden, a dated zone map, consistent rating scale, and harvest log usually provide more reliable insight than an elaborate spreadsheet filled with inconsistent observations.
Set Intervention Priorities and Verify the Outcome
Action thresholds should reflect crop risk rather than a universal pest count. Tolerance is lower when pests contaminate edible leaves, attack propagation stock, reproduce rapidly, or appear shortly before harvest. A small colony on young transplants may justify immediate isolation because those plants can distribute pests throughout the facility. Limited cosmetic injury on an older nonedible crop may permit closer monitoring before disruptive treatment.
Prioritize containment when the infestation is concentrated. Separate incoming or affected plants where possible, remove severely infested material in sealed containers, clean tools between zones, and avoid carrying pests on hands or clothing from affected to clean areas. Review vents, doors, screens, plant deliveries, and crop residues for likely entry or survival points. Sanitation cannot reverse existing feeding damage, but it can reduce sources that sustain the next generation.
Control choice must account for crop stage, pest identity, hydroponic equipment, label directions, worker safety, and any beneficial organisms already present. Contact treatments may miss pests inside folded leaves or dense canopies. Biological controls may work best when introduced while populations are still limited, but their performance can be affected by environmental conditions and incompatible residues. Removing a near-harvest crop can sometimes be more practical than repeated treatment that leaves quality unacceptable.
Verify results with the same measurements used before intervention. Check live pest stages, newly occupied plants, fresh injury, trap trends, and the quality of new growth. Record the treatment date and avoid judging it only from the next day’s trap count. Adults may continue emerging, old damage remains visible, and some controls act on particular life stages rather than producing an immediate decline across the whole population.
Signs of progress include fewer new colonies, stable or shrinking affected zones, clean emerging leaves, lower capture rates across comparable intervals, and reduced rejection at harvest. Failure is indicated by movement into new zones, continued injury on fresh tissue, recurring populations after temporary decline, or treatment damage that rivals pest injury. When results are poor, reassess identification, coverage, life-cycle timing, reintroduction sources, and whether environmental stress is weakening the plants.
The most damaging mistake is repeatedly changing controls without preserving monitoring data. That approach increases cost and crop disruption while obscuring what worked. Keep an intervention log linked to zone-level observations. The record turns each outbreak into evidence for future crop scheduling, quarantine, scouting frequency, and earlier action.
Frequently Asked Questions
How often should hydroponic crops be checked for pests?
Inspect at least weekly under low pressure and more frequently during propagation, after new plants arrive, or when captures and fresh injury are increasing. Use the same zones and plant structures each time.
Are sticky-trap counts enough to measure crop damage?
No. Traps mainly reveal activity by certain mobile adults. Pair counts with direct plant inspections, fresh injury ratings, affected-area mapping, and harvest-quality records.
Should old damaged leaves be removed before scoring?
Record and photograph their condition first. After removal, evaluate new growth separately so persistent scars are not mistaken for continuing pest activity.
What is the clearest sign that pests are affecting yield?
A repeatable difference between affected and comparable healthy zones in harvest mass, harvest timing, rejected produce, or plant loss is stronger evidence than visual injury alone.
When should an affected plant be discarded?
Removal is reasonable when a plant is a concentrated pest source, cannot meet harvest standards, threatens clean propagation material, or would require disproportionate labor to treat and monitor.
Conclusion
Reliable pest-impact decisions come from linking identification and fresh injury to location, crop stage, production records, and change over time. Establish comparable crop zones, inspect the plant structures where the suspected pest actually lives, and keep abundance separate from severity. Confirm that pH, nutrition, irrigation, temperature, and root conditions are not creating similar symptoms.
Next, choose a simple rating scale, photograph reference levels, and connect scouting records to harvest quality and labor. Intervene according to spread and crop risk rather than reacting to an isolated count. After any control measure, repeat the original sampling routine and judge clean new growth, active life stages, occupied zones, and rejection rates. That disciplined record shows whether pressure is declining, whether the response needs adjustment, and where prevention should focus during the next production cycle.
Related Content
- The Ultimate 2025 Guide to the Best Hydroponic Grow Tower Strategies
- Issues With Root Development in Hydroponic Systems: Common Causes and Solutions
- How to Grow Microgreens Hydroponically for High Returns
- Sustainable Hydroponic Gardening: Techniques for Efficient Resource Use and Healthy Plants
- The Environmental Impact of Hydroponic Farming